Monthly Data
~ 44,000 saving in credits
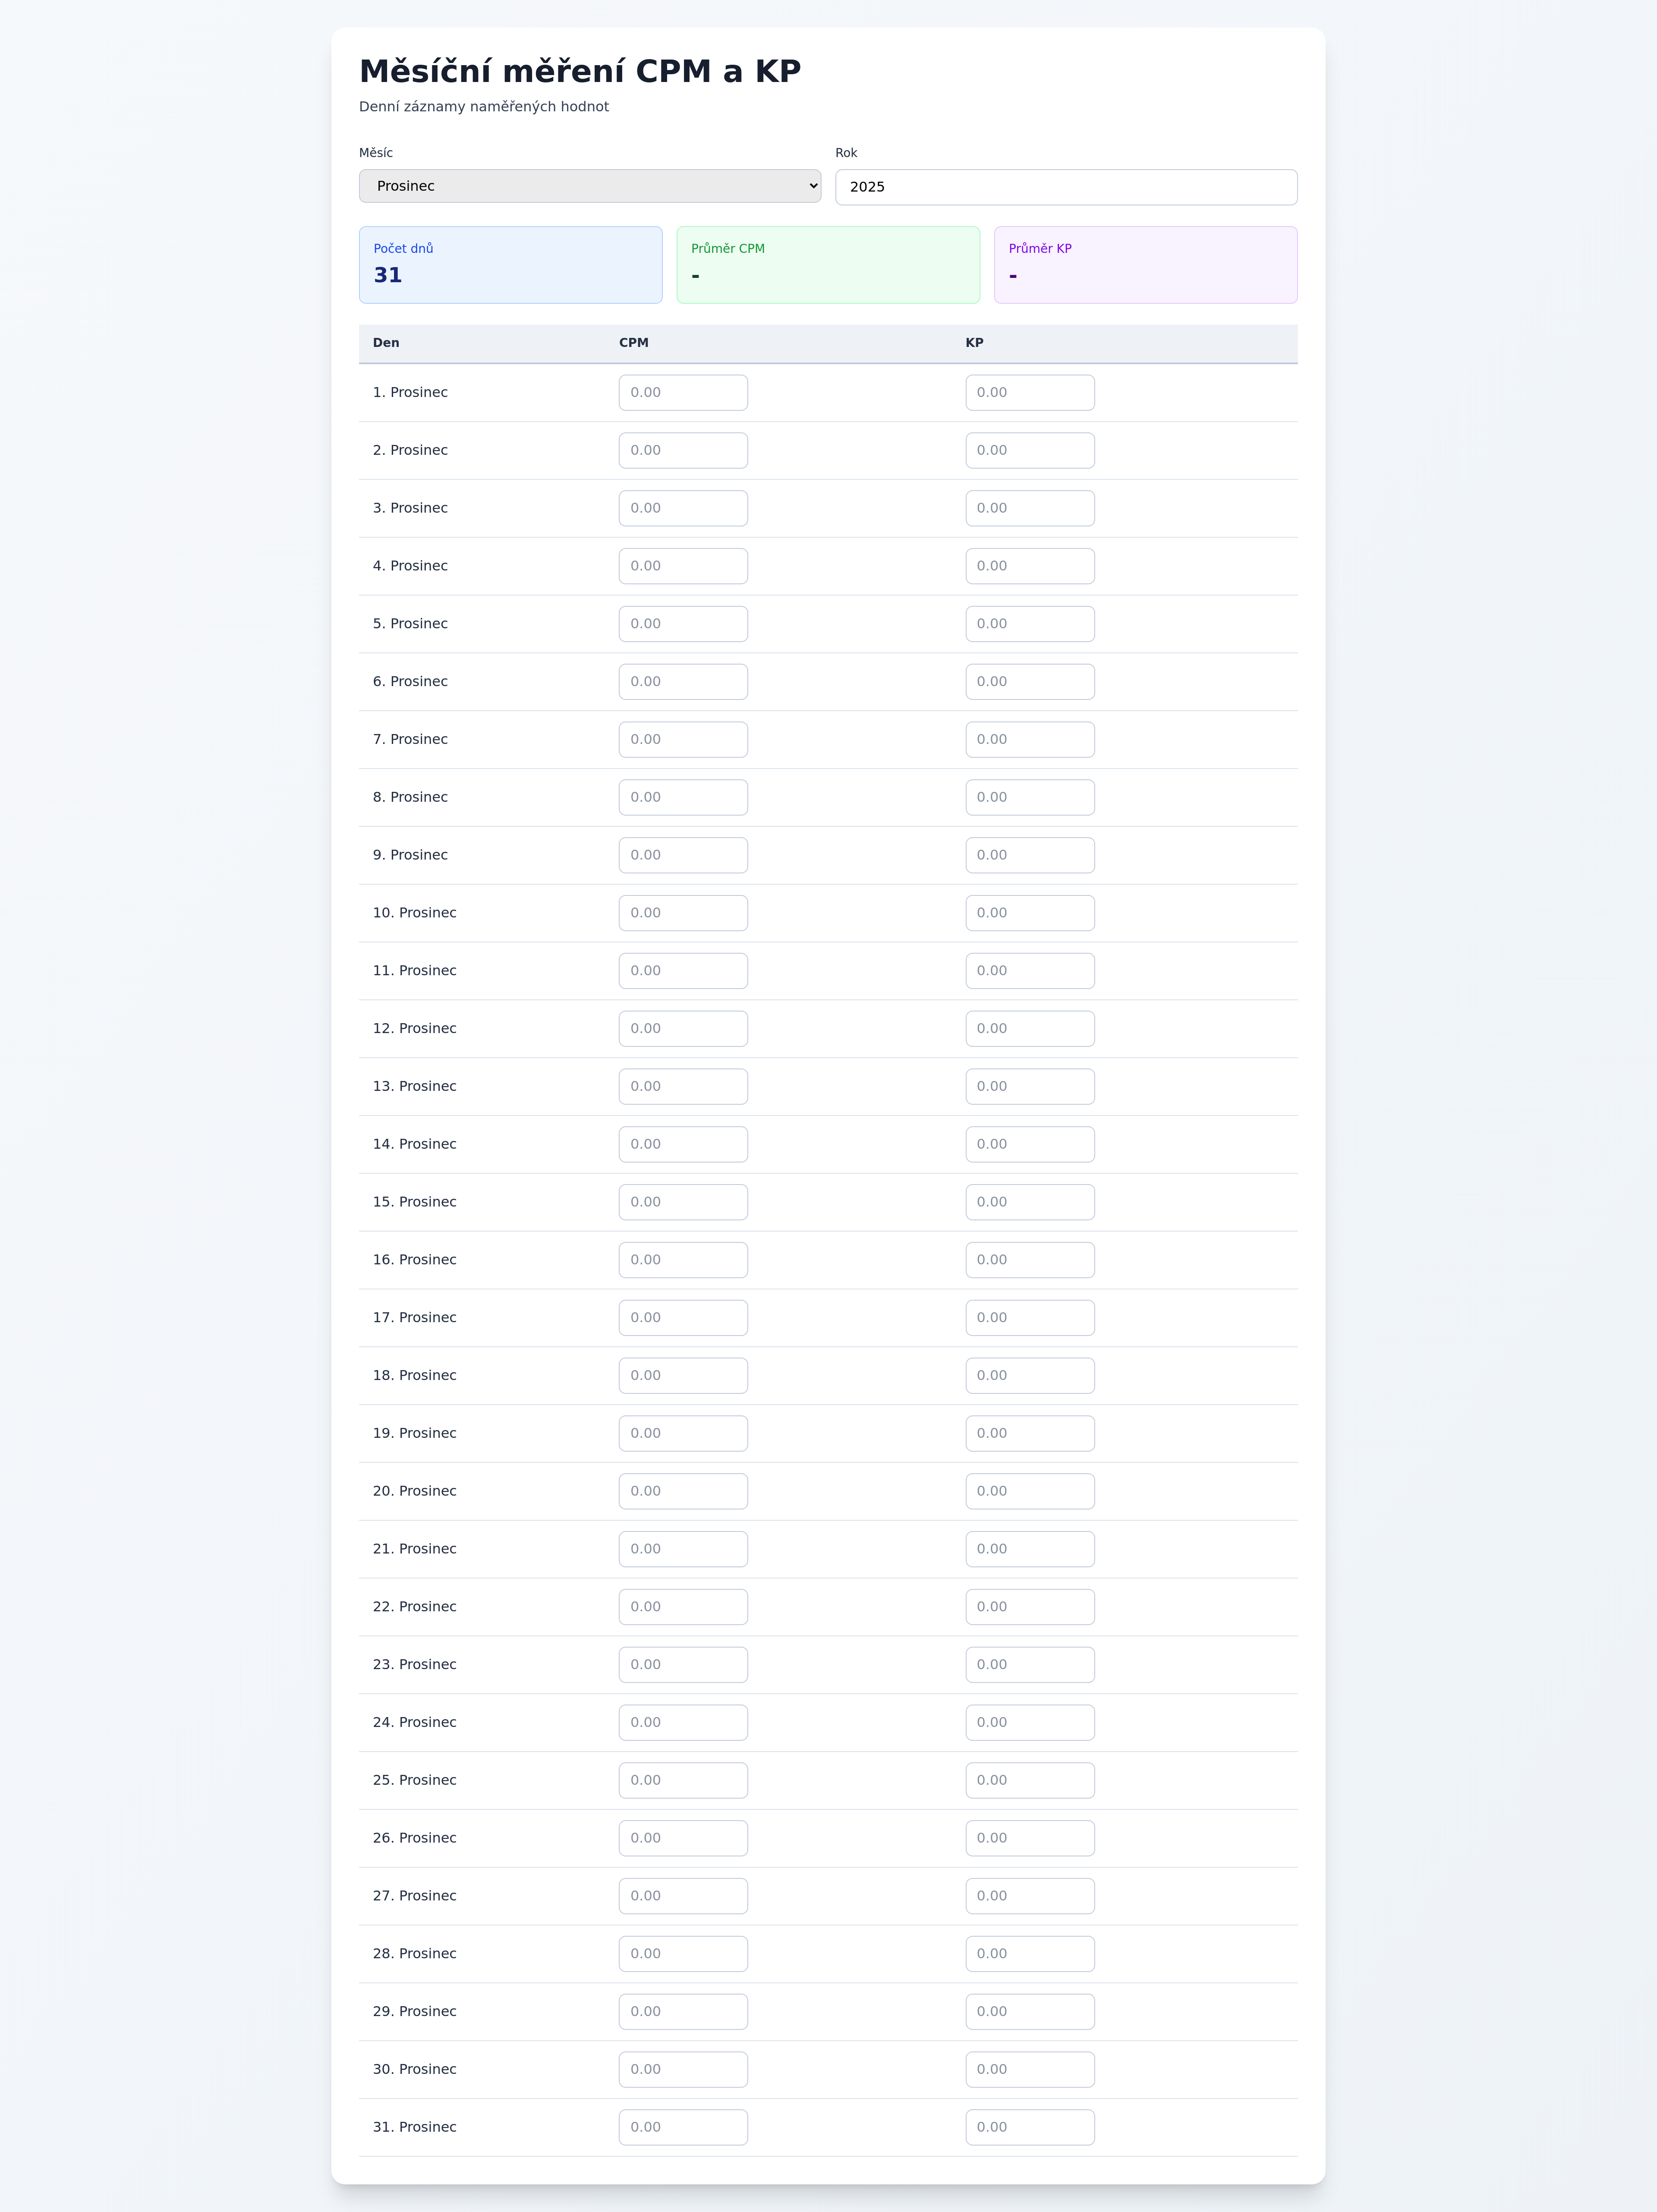
This project creates a data table displaying daily CPM (Cost Per Mille) and KP (Key Performance) values, alongside the number of days in each month. It is designed for marketing analysts and businesses to track and analyze advertising performance and key metrics over time, providing clear insights into monthly trends and daily fluctuations.
dashboard
marketing-site
web-app
Discover more community templates in our collection
Browse All Community Templates